Massive overnight surplus of 30.3 GW driven by coal baseload, gas, and strong wind, with anomalous solar data at 2 AM.
Back
Generation mix
Wind onshore 7%
Wind offshore 3%
Solar 48%
Biomass 5%
Hydro 1%
Natural gas 11%
Hard coal 10%
Brown coal 15%
65%
Renewable share
8.3 GW
Wind (on + offshore)
37.1 GW
Solar
77.5 GW
Total generation
+30.3 GW
Net export
89.5 €/MWh
Day-ahead price
0.5°C / 14 km/h
Temp / Wind speed
Open-Meteo, Kassel (51.3°N 9.5°E)
70.0% / 0.0 W/m²
Cloud cover / Radiation
244
gCO₂/kWh
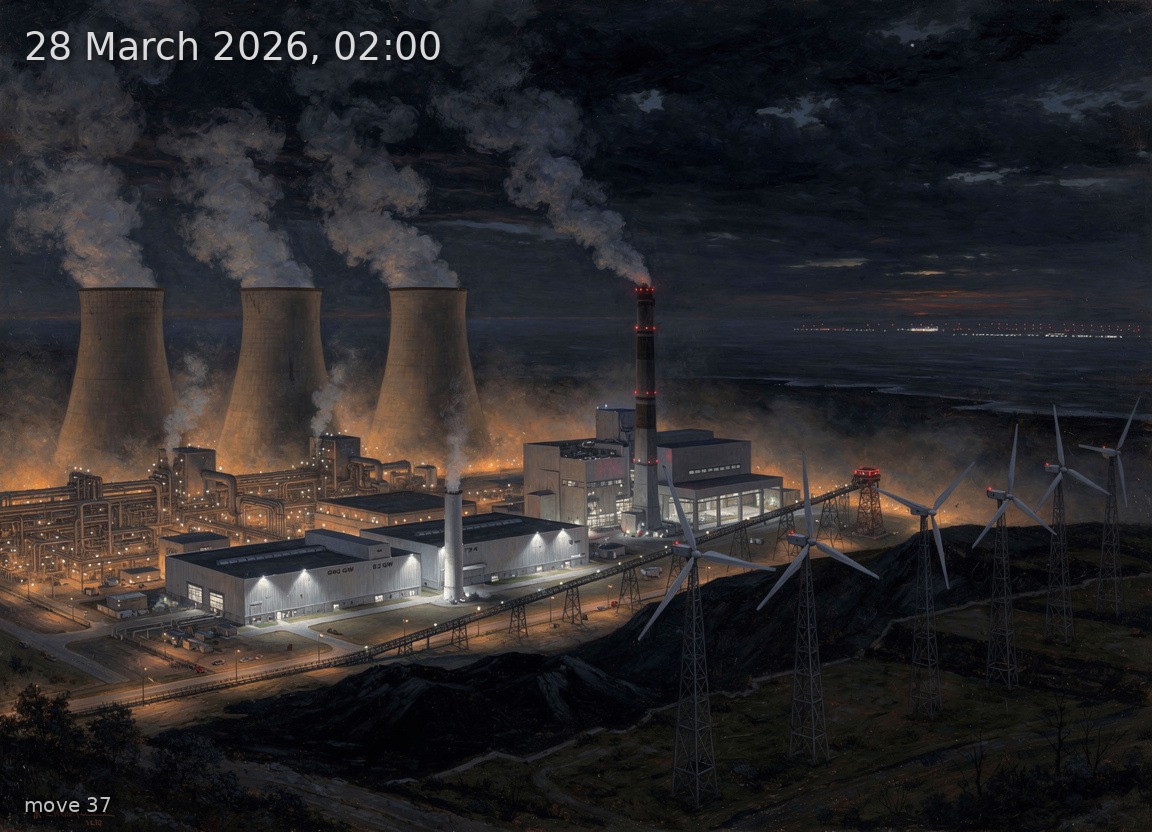
Image prompt
Brown coal 11.3 GW dominates the left third of the scene as a sprawling lignite power station with four massive hyperbolic cooling towers emitting thick white steam plumes into the black night sky, lit from below by orange sodium lamps. Natural gas 8.2 GW occupies the centre-left as two compact CCGT plants with tall single exhaust stacks venting thin heat shimmer, their turbine halls illuminated by industrial floodlights. Hard coal 7.4 GW appears centre-right as a classic coal-fired station with a single large chimney and conveyor belt infrastructure, red aviation warning lights blinking on the stack. Wind onshore 5.7 GW stretches across the right portion as a row of tall three-blade turbines on lattice towers, their rotors turning moderately in the night breeze, red nacelle warning lights visible. Wind offshore 2.6 GW is suggested on the far right horizon as distant blinking lights over a dark flat plain implying the North Sea coast. Biomass 4.1 GW appears as a modest biogas facility with a domed digester and small exhaust, glowing warmly near the coal station. Hydro 1.0 GW is a small run-of-river weir in the foreground, water glinting under artificial light. The sky is completely black to deep navy — it is 2 AM in late March, absolutely no twilight, no sky glow, no moon visible. Cloud cover at 70% obscures most stars. Temperature near freezing: frost glistens on the ground, bare winter branches on scattered trees, patches of old snow in ditches. The atmosphere feels heavy and oppressive despite the darkness, reflecting the high electricity price — thick industrial haze hangs low, sodium-orange light pollution creates a dull dome over the power stations. No solar panels anywhere — the scene is entirely nocturnal. Rendered as a highly detailed oil painting in the tradition of 19th-century German Romantic landscape painters — rich, dark palette of Prussian blue, lamp black, and warm orange-amber; visible impasto brushwork in the steam plumes; atmospheric depth with haze layering; meticulous engineering accuracy on every turbine nacelle, cooling tower profile, and exhaust stack. The composition evokes Caspar David Friedrich's sense of sublime scale but applied to an industrial nocturnal panorama. No text, no labels.