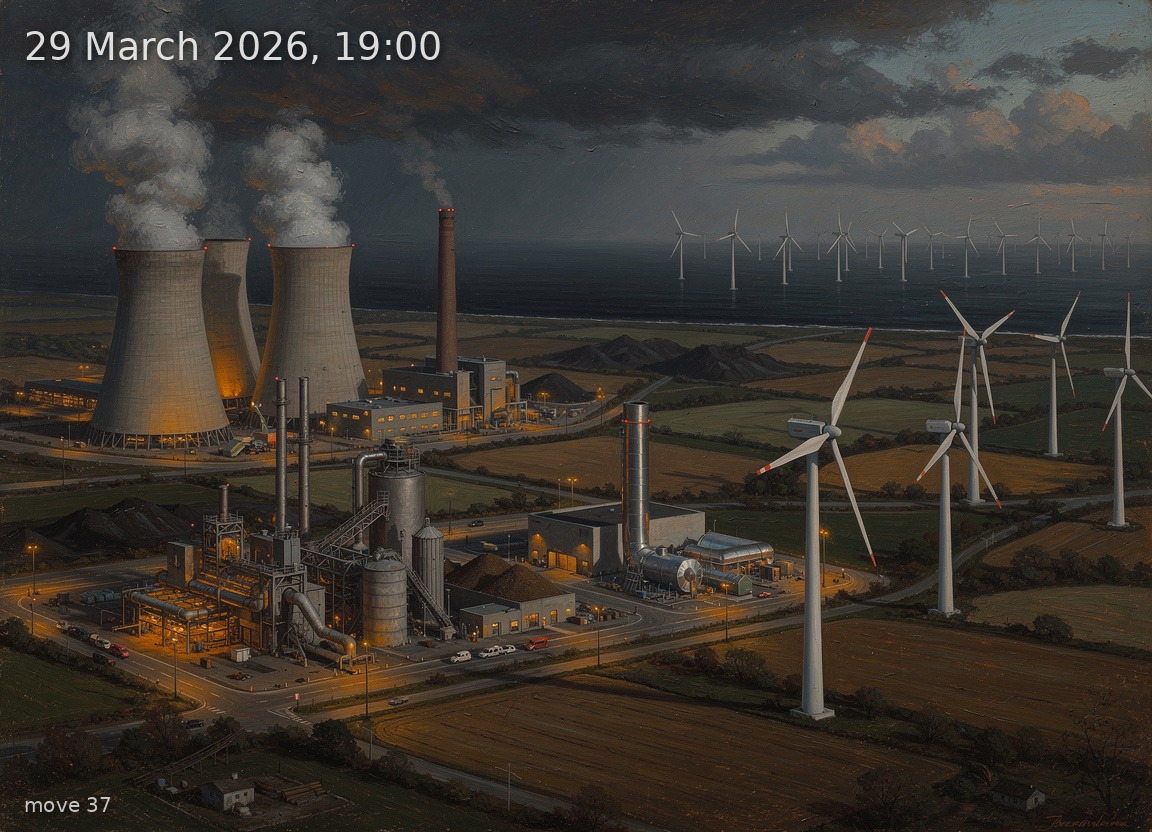
Strong wind leads generation but 15 GW net imports are needed as evening demand outpaces domestic supply at high prices.
Back
Generation mix
Wind onshore 44%
Wind offshore 16%
Solar 2%
Biomass 11%
Hydro 3%
Natural gas 7%
Hard coal 6%
Brown coal 12%
75%
Renewable share
23.5 GW
Wind (on + offshore)
0.9 GW
Solar
39.6 GW
Total generation
-15.1 GW
Net import
105.7 €/MWh
Day-ahead price
7.8°C / 8 km/h
Temp / Wind speed
Open-Meteo, Kassel (51.3°N 9.5°E)
100.0% / 6.0 W/m²
Cloud cover / Radiation
175
gCO₂/kWh
Image prompt
Wind onshore 17.3 GW dominates the right two-thirds of the scene as dozens of towering three-blade turbines with white tubular towers and detailed nacelles stretching across rolling farmland into the distance; wind offshore 6.2 GW appears as a distant line of larger turbines on the far-right horizon above a dark sea; brown coal 4.7 GW occupies the left foreground as a massive lignite power station with three hyperbolic concrete cooling towers emitting thick white-grey steam plumes; biomass 4.4 GW sits left-of-centre as a cluster of industrial wood-chip-fired plants with squat chimneys and conveyor belts feeding fuel; natural gas 2.7 GW appears as a compact CCGT facility with a single tall exhaust stack and a smaller heat-recovery unit beside the coal station; hard coal 2.4 GW is rendered as a second power station behind the lignite plant with a tall brick chimney and coal bunkers; hydro 1.2 GW is a small dam and powerhouse visible in a valley at mid-left; solar 0.9 GW is represented only by a tiny, barely visible cluster of dark aluminium-framed panels on a rooftop, unlit and inactive. TIME AND LIGHT: 19:00 late March dusk — the sky is a narrow band of deep burnt-orange and crimson along the lower western horizon, rapidly transitioning to slate-grey and then near-black overhead; 100% cloud cover creates a heavy, oppressive blanket of stratus with no stars visible; the landscape is mostly dark, lit by sodium-yellow industrial lights on the power stations and red aviation warning lights blinking on the turbine nacelles. The high electricity price is conveyed through a brooding, heavy, pressurized atmosphere — thick low clouds pressing down on the industrial landscape. Vegetation is early-spring bare: leafless deciduous trees, brown-green fields with first shoots of grass, patches of mud, temperature around 8°C suggesting damp cool air with visible breath-like mist near ground level. Highly detailed oil painting in the tradition of 19th-century German Romantic landscape painters — rich, dark palette of umber, ochre, slate blue, and warm industrial orange; visible impasto brushwork; atmospheric aerial perspective with the distant offshore turbines fading into haze; dramatic chiaroscuro between the glowing industrial facilities and the encroaching darkness. Meticulous engineering accuracy on all turbine components, cooling tower geometries, and plant infrastructure. No text, no labels.