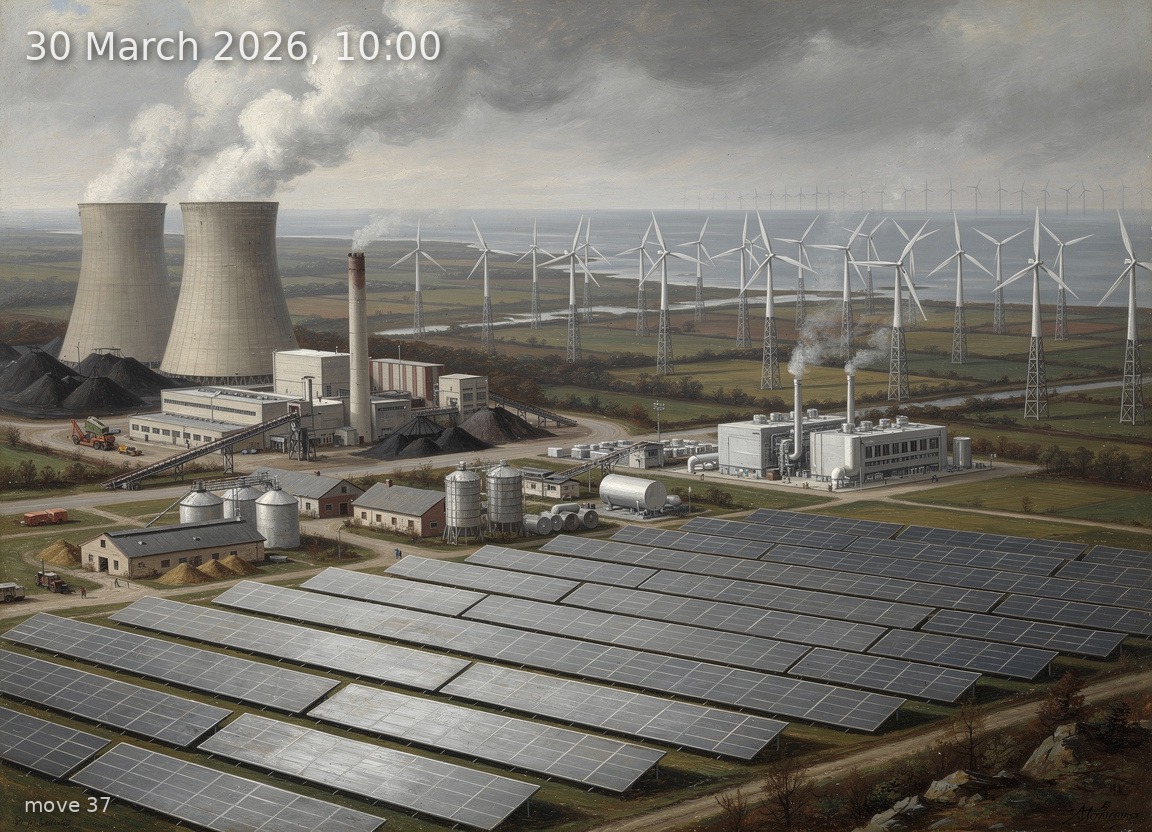
Wind energy leads at 33.7 GW under heavy overcast, with fossil plants and modest solar filling the remaining demand.
Back
Generation mix
Wind onshore 43%
Wind offshore 8%
Solar 20%
Biomass 7%
Hydro 2%
Natural gas 7%
Hard coal 7%
Brown coal 7%
80%
Renewable share
33.7 GW
Wind (on + offshore)
13.1 GW
Solar
65.5 GW
Total generation
-1.6 GW
Net import
73.8 €/MWh
Day-ahead price
5.0°C / 30 km/h
Temp / Wind speed
Open-Meteo, Kassel (51.3°N 9.5°E)
96.0% / 95.8 W/m²
Cloud cover / Radiation
138
gCO₂/kWh
Image prompt
Wind onshore 28.2 GW dominates the scene as vast ranks of three-blade turbines on lattice towers stretching across a sweeping German plain, their rotors spinning vigorously in strong wind, occupying roughly 43% of the composition across the right and centre-right. Wind offshore 5.5 GW appears as a distant row of larger turbines on the far horizon over a grey North Sea inlet at the far right, about 8% of the scene. Solar 13.1 GW fills the centre-left foreground as extensive fields of aluminium-framed crystalline silicon PV panels on low-angle ground mounts, their surfaces reflecting only diffuse grey light, occupying about 20% of the composition. Brown coal 4.4 GW stands at the far left as two massive hyperbolic cooling towers with thick white-grey steam plumes merging into the overcast, about 7% of the scene. Hard coal 4.3 GW appears just right of the brown coal as a large power station with a tall concrete chimney and coal conveyors, roughly 7%. Natural gas 4.4 GW sits between the coal complex and the solar field as compact combined-cycle gas turbine units with sleek single exhaust stacks emitting thin plumes, about 7%. Biomass 4.5 GW appears as a cluster of medium-sized industrial buildings with wood-chip silos and a modest smokestack near the centre-left, roughly 7%. Hydro 1.1 GW is a small run-of-river weir with a low concrete dam visible in a river cutting through the foreground, about 2%. The sky is 96% overcast — a heavy, uniform blanket of stratocumulus in layered grey tones pressing down oppressively, with only faint diffuse brightness suggesting the sun behind clouds at a 10 o'clock morning angle, consistent with late March at 52°N. The light is flat and cool, no shadows. Temperature 5°C: bare deciduous trees with the faintest hint of early spring buds, brown-green dormant grass, patches of mud. Strong 30 km/h wind bends the grass and drives turbine blades at visible speed, small flags on industrial buildings pulled taut. The atmosphere is slightly heavy and leaden, reflecting the moderate 73.8 EUR/MWh price — not oppressive, but weighty. Painted in the style of a highly detailed 19th-century German Romantic oil painting — rich impasto brushwork, atmospheric depth with aerial perspective fading the offshore turbines into mist, dramatic tonal range from the dark coal complex to the pale overcast sky — yet with meticulous engineering accuracy in every turbine nacelle, every PV cell grid line, every cooling tower's hyperbolic curvature. No text, no labels.