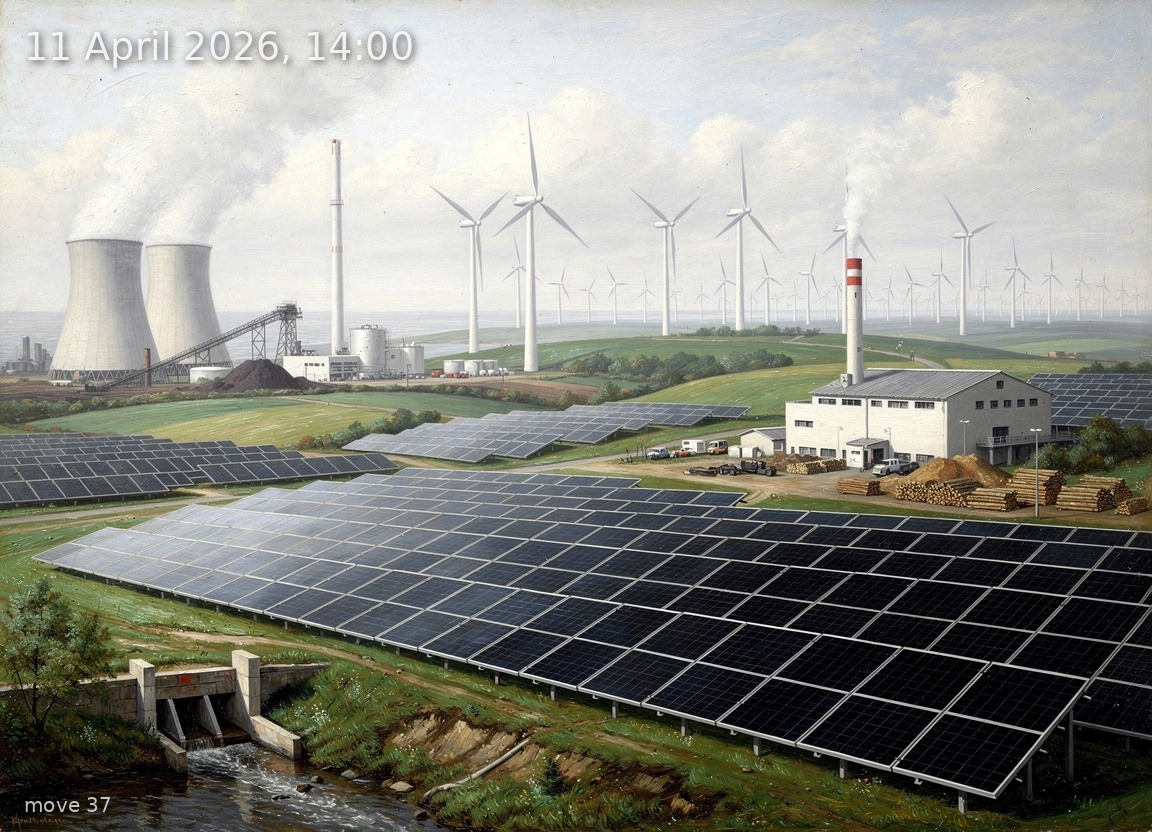
Solar at 46.9 GW and 15.8 GW wind drive 21.1 GW net export and deeply negative prices.
Back
Generation mix
Wind onshore 15%
Wind offshore 7%
Solar 64%
Biomass 6%
Hydro 2%
Natural gas 3%
Hard coal 1%
Brown coal 3%
93%
Renewable share
15.8 GW
Wind (on + offshore)
46.9 GW
Solar
73.1 GW
Total generation
+21.1 GW
Net export
-77.6 €/MWh
Day-ahead price
16.3°C / 20 km/h
Temp / Wind speed
Open-Meteo, Kassel (51.3°N 9.5°E)
100.0% / 379.2 W/m²
Cloud cover / Radiation
46
gCO₂/kWh
Image prompt
Solar 46.9 GW dominates the scene as an immense foreground and middle-ground expanse of crystalline silicon photovoltaic panels stretching across gently rolling central German farmland, their aluminium frames glinting under diffused white daylight filtered through total overcast — panels cover roughly two-thirds of the composition. Wind onshore 10.9 GW appears as dozens of three-blade turbines with white tubular towers arrayed along ridgelines in the middle distance, rotors spinning briskly in 20 km/h wind. Wind offshore 4.9 GW is suggested by a cluster of taller offshore turbines visible on the far horizon through haze. Biomass 4.1 GW occupies a modest area at right-centre as a wood-chip-fired combined heat and power plant with a low smokestack and small steam plume beside stacked timber. Brown coal 2.4 GW appears at the far left as a pair of hyperbolic cooling towers releasing gentle white steam columns beside a lignite conveyor belt. Natural gas 2.1 GW sits beside them as a compact CCGT plant with a single slender exhaust stack and modest heat shimmer. Hydro 1.3 GW is represented by a small concrete weir and penstock in a stream in the lower-left corner. Hard coal 0.5 GW is a barely visible small stack behind the brown coal plant. The sky is uniformly overcast with a thick white-grey cloud layer but the scene is brightly lit — full midday April daylight at 14:00, no shadows, soft even illumination. The air feels calm and open, reflecting deeply negative prices — no oppressive weight, the atmosphere is luminous and expansive. Spring vegetation: fresh bright green grass, early leaf buds on scattered birch and beech trees, dandelions dotting meadow edges. Painted in the style of a highly detailed 19th-century German Romantic oil painting — visible impasto brushwork, rich saturated greens and silvers, atmospheric aerial perspective fading to milky haze at the horizon — yet every turbine nacelle, every PV cell grid line, every cooling tower hyperbolic curve is rendered with meticulous engineering accuracy. No text, no labels.