Solar leads at 20 GW under heavy overcast; 12.5 GW net imports cover the gap to 49.3 GW demand.
Back
Generation mix
Wind onshore 6%
Wind offshore 7%
Solar 54%
Biomass 11%
Hydro 4%
Natural gas 6%
Hard coal 2%
Brown coal 10%
82%
Renewable share
4.8 GW
Wind (on + offshore)
20.0 GW
Solar
36.8 GW
Total generation
-12.5 GW
Net import
15.9 €/MWh
Day-ahead price
12.9°C / 4 km/h
Temp / Wind speed
Open-Meteo, Kassel (51.3°N 9.5°E)
92.0% / 190.8 W/m²
Cloud cover / Radiation
125
gCO₂/kWh
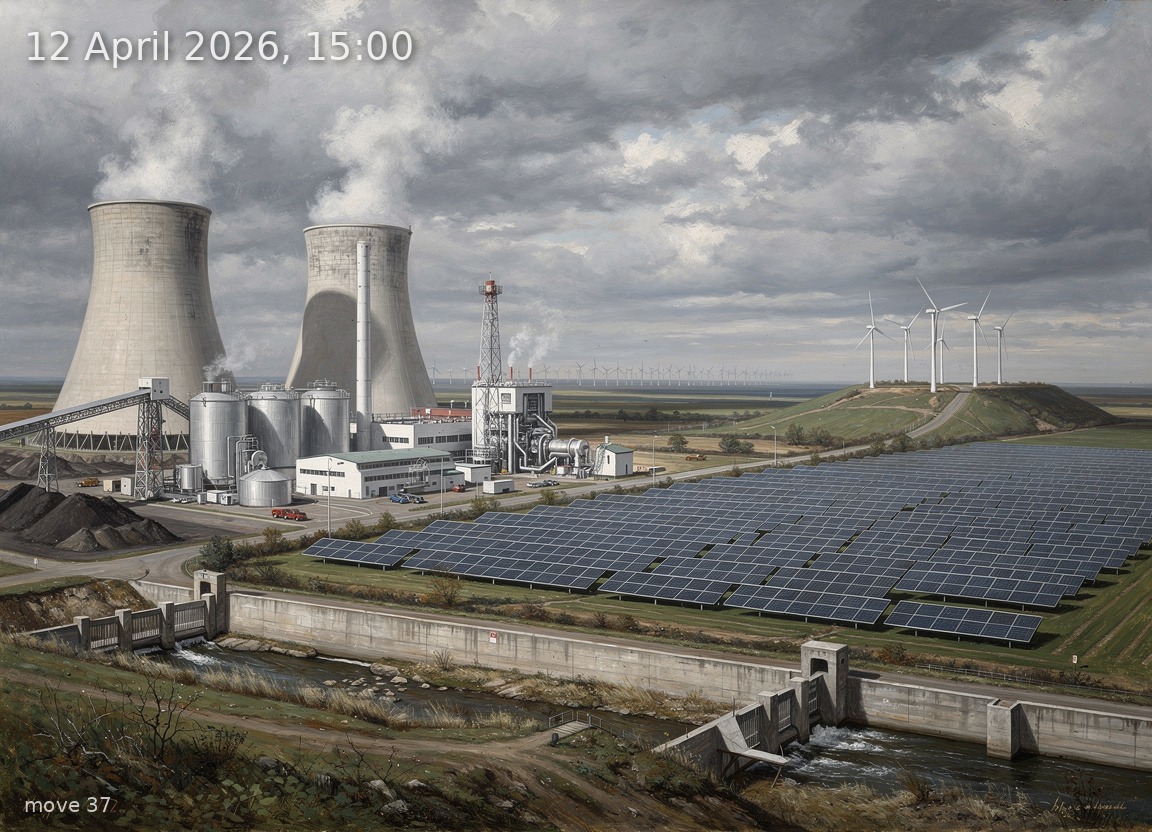
Image prompt
Solar 20.0 GW dominates the centre and right of the composition as vast fields of aluminium-framed crystalline silicon PV panels stretching across flat farmland, their surfaces reflecting a pale diffuse light; wind onshore 2.1 GW appears as a small cluster of three-blade turbines with lattice towers on a gentle ridge at far right, blades barely turning; wind offshore 2.7 GW is suggested by a line of distant offshore turbines visible on a hazy horizon at far right; biomass 4.1 GW occupies the left-centre as a cluster of compact wood-chip and biogas plants with modest stacks trailing thin white exhaust; brown coal 3.8 GW fills the left third of the scene as two large hyperbolic cooling towers with heavy steam plumes rising into the grey sky, adjacent conveyor belts and lignite stockpiles visible; natural gas 2.1 GW appears as a single compact CCGT plant with a slender exhaust stack and heat-recovery unit just left of centre; hydro 1.5 GW is rendered as a concrete run-of-river weir with spillway along a small river in the foreground; hard coal 0.6 GW is a single smaller stack with a thin wisp of smoke at far left. Time is 15:00 on an April afternoon: full daylight but heavily overcast at 92% cloud cover, the sky a uniform sheet of silver-grey stratus with no blue visible, light flat and diffuse, no hard shadows on the ground. Temperature is a mild 12.9 °C: early spring vegetation, fresh pale-green buds on birch and willow trees, damp green grass. Wind is nearly still at 3.8 km/h — steam plumes from the cooling towers rise almost vertically, grass is motionless. The low electricity price of 15.9 EUR/MWh is evoked by a calm, open, unhurried atmosphere — no oppressive haze. High-voltage transmission pylons with bundled conductors recede toward the horizon, symbolising the large net import flows. Style: highly detailed oil painting in the tradition of 19th-century German Romantic landscape painters — Caspar David Friedrich's atmospheric depth crossed with Adolph Menzel's industrial precision — rich layered colour, visible confident brushwork, dramatic atmospheric perspective, meticulous engineering detail on every turbine nacelle, every panel frame, every cooling tower's parabolic curve. No text, no labels.