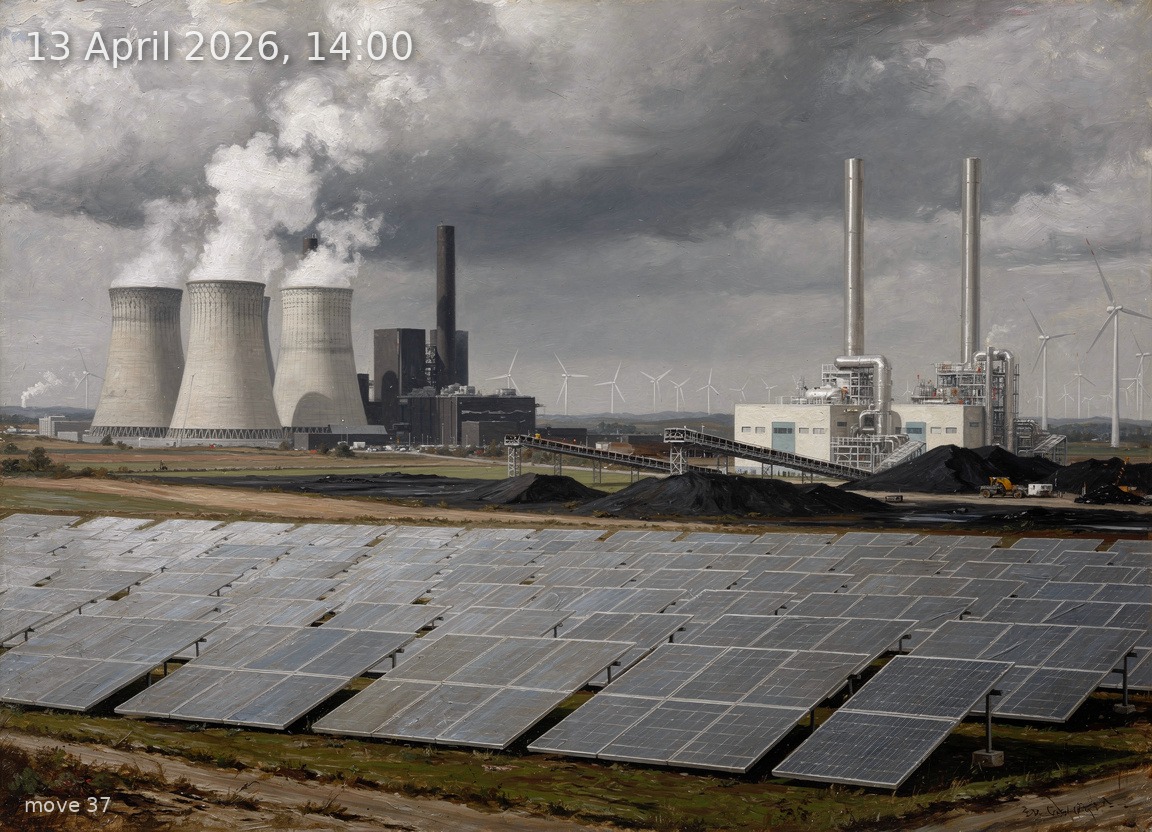
Solar leads at 22.2 GW under full overcast; coal and gas fill the gap as light winds and cloud suppress renewables.
Back
Generation mix
Wind onshore 15%
Wind offshore 3%
Solar 37%
Biomass 7%
Hydro 3%
Natural gas 15%
Hard coal 10%
Brown coal 11%
64%
Renewable share
10.9 GW
Wind (on + offshore)
22.2 GW
Solar
60.1 GW
Total generation
-3.2 GW
Net import
101.7 €/MWh
Day-ahead price
10.9°C / 4 km/h
Temp / Wind speed
Open-Meteo, Kassel (51.3°N 9.5°E)
100.0% / 7.2 W/m²
Cloud cover / Radiation
236
gCO₂/kWh
Image prompt
Solar 22.2 GW dominates the foreground as vast fields of aluminium-framed crystalline silicon PV panels stretching across flat farmland, their surfaces reflecting only diffuse grey light—no direct sunshine, no shadows; brown coal 6.7 GW occupies the left background as a cluster of massive hyperbolic concrete cooling towers emitting thick white steam plumes that merge with the overcast sky; hard coal 5.9 GW sits beside it as a darker industrial complex with tall square smokestacks and coal conveyor belts; natural gas 8.8 GW fills the centre-right as three modern CCGT power plants with slender polished exhaust stacks and compact turbine halls; wind onshore 9.1 GW appears as a line of three-blade turbines on low ridges in the middle distance, rotors barely turning in negligible wind; wind offshore 1.9 GW is visible as a faint row of turbines on the far horizon; biomass 4.0 GW is a modest wood-chip plant with a short steaming chimney near a forested edge; hydro 1.5 GW is a small run-of-river weir with white water on a river cutting through the scene. Time is early afternoon: full daylight but entirely diffuse under a uniformly grey, heavy, low-hanging 100% cloud ceiling—no blue sky visible anywhere. The atmosphere feels oppressive and weighty, hinting at elevated electricity prices. Temperature is a cool 10.9 °C spring day: bare branches on some trees, early green buds on others, damp brown and green fields. Style: highly detailed oil painting in the tradition of 19th-century German Romantic landscape painters such as Caspar David Friedrich and Carl Blechen—rich muted earth tones, visible impasto brushwork, atmospheric depth and haze, meticulous engineering detail on every turbine nacelle, lattice tower, cooling tower, and PV panel frame. The composition sweeps panoramically, giving each energy source visual area proportional to its GW share. No text, no labels.